Prometheus & Grafana
Prometheus is an open-source monitoring system with a dimensional data model, flexible query language, efficient time series database and modern alerting approach. Grafana is an open-source tool used for analyzing and visualizing metrics.
This following tutorial guides you through deploying and integrating Databend, Prometheus, and Grafana. In this tutorial, you'll deploy a local Databend and install Prometheus and Grafana with Docker. Before you start, ensure that you have Docker installed.
Tutorial: Monitor Databend with Prometheus & Grafana
Step 1. Deploy Databend
Follow the Deployment Guide to deploy a local Databend.
This tutorial uses the default configuration files in the configs folder of the install package. The metrics API for databend-meta is 0.0.0.0:28101/v1/metrics, and the metrics API for databend-query is 0.0.0.0:7070/metrics.
Step 2. Deploy Prometheus
The steps below describe how to install and deploy Prometheus using Docker.
Pull the latest Docker image of Prometheus from the Docker Hub registry.
docker pull prom/prometheusEdit the configuration file prometheus.yml.
Add the following script to the end of the file prometheus.yml that can be found in the
/etc/prometheus/prometheus.ymldirectory. Please note that, with Docker, there are multiple ways to modify a file for a container. In this tutorial, we demonstrate how to achieve this by saving the file to a local folder and mapping it when running the Prometheus image.tipDocker containers can connect to local services running on the host by using
host.docker.internal. This feature is available by default only on Docker for Windows/Mac. However, it is also available on Linux starting from version 20.03.- job_name: "databend-query"
# metrics_path defaults to '/metrics'
# scheme defaults to 'http'.
static_configs:
- targets: ["host.docker.internal:7070"]
- job_name: "databend-meta"
metrics_path: "/v1/metrics"
# scheme defaults to 'http'.
static_configs:
- targets: ["host.docker.internal:28101"]Deploy Prometheus.
If you saved and edited the file
prometheus.ymlin a local folder, you need to create a mapping using the-voption in the command. To do so, replace/path/to/prometheus.ymlin the command below with the path to your localprometheus.yml.docker run \
-p 9090:9090 \
--add-host=host.docker.internal:host-gateway \
-v /path/to/prometheus.yml:/etc/prometheus/prometheus.yml \
prom/prometheusCheck Metrics Status
Check the value on the right of each instance.
1means the instance is healthy, and0means that the scrape failed.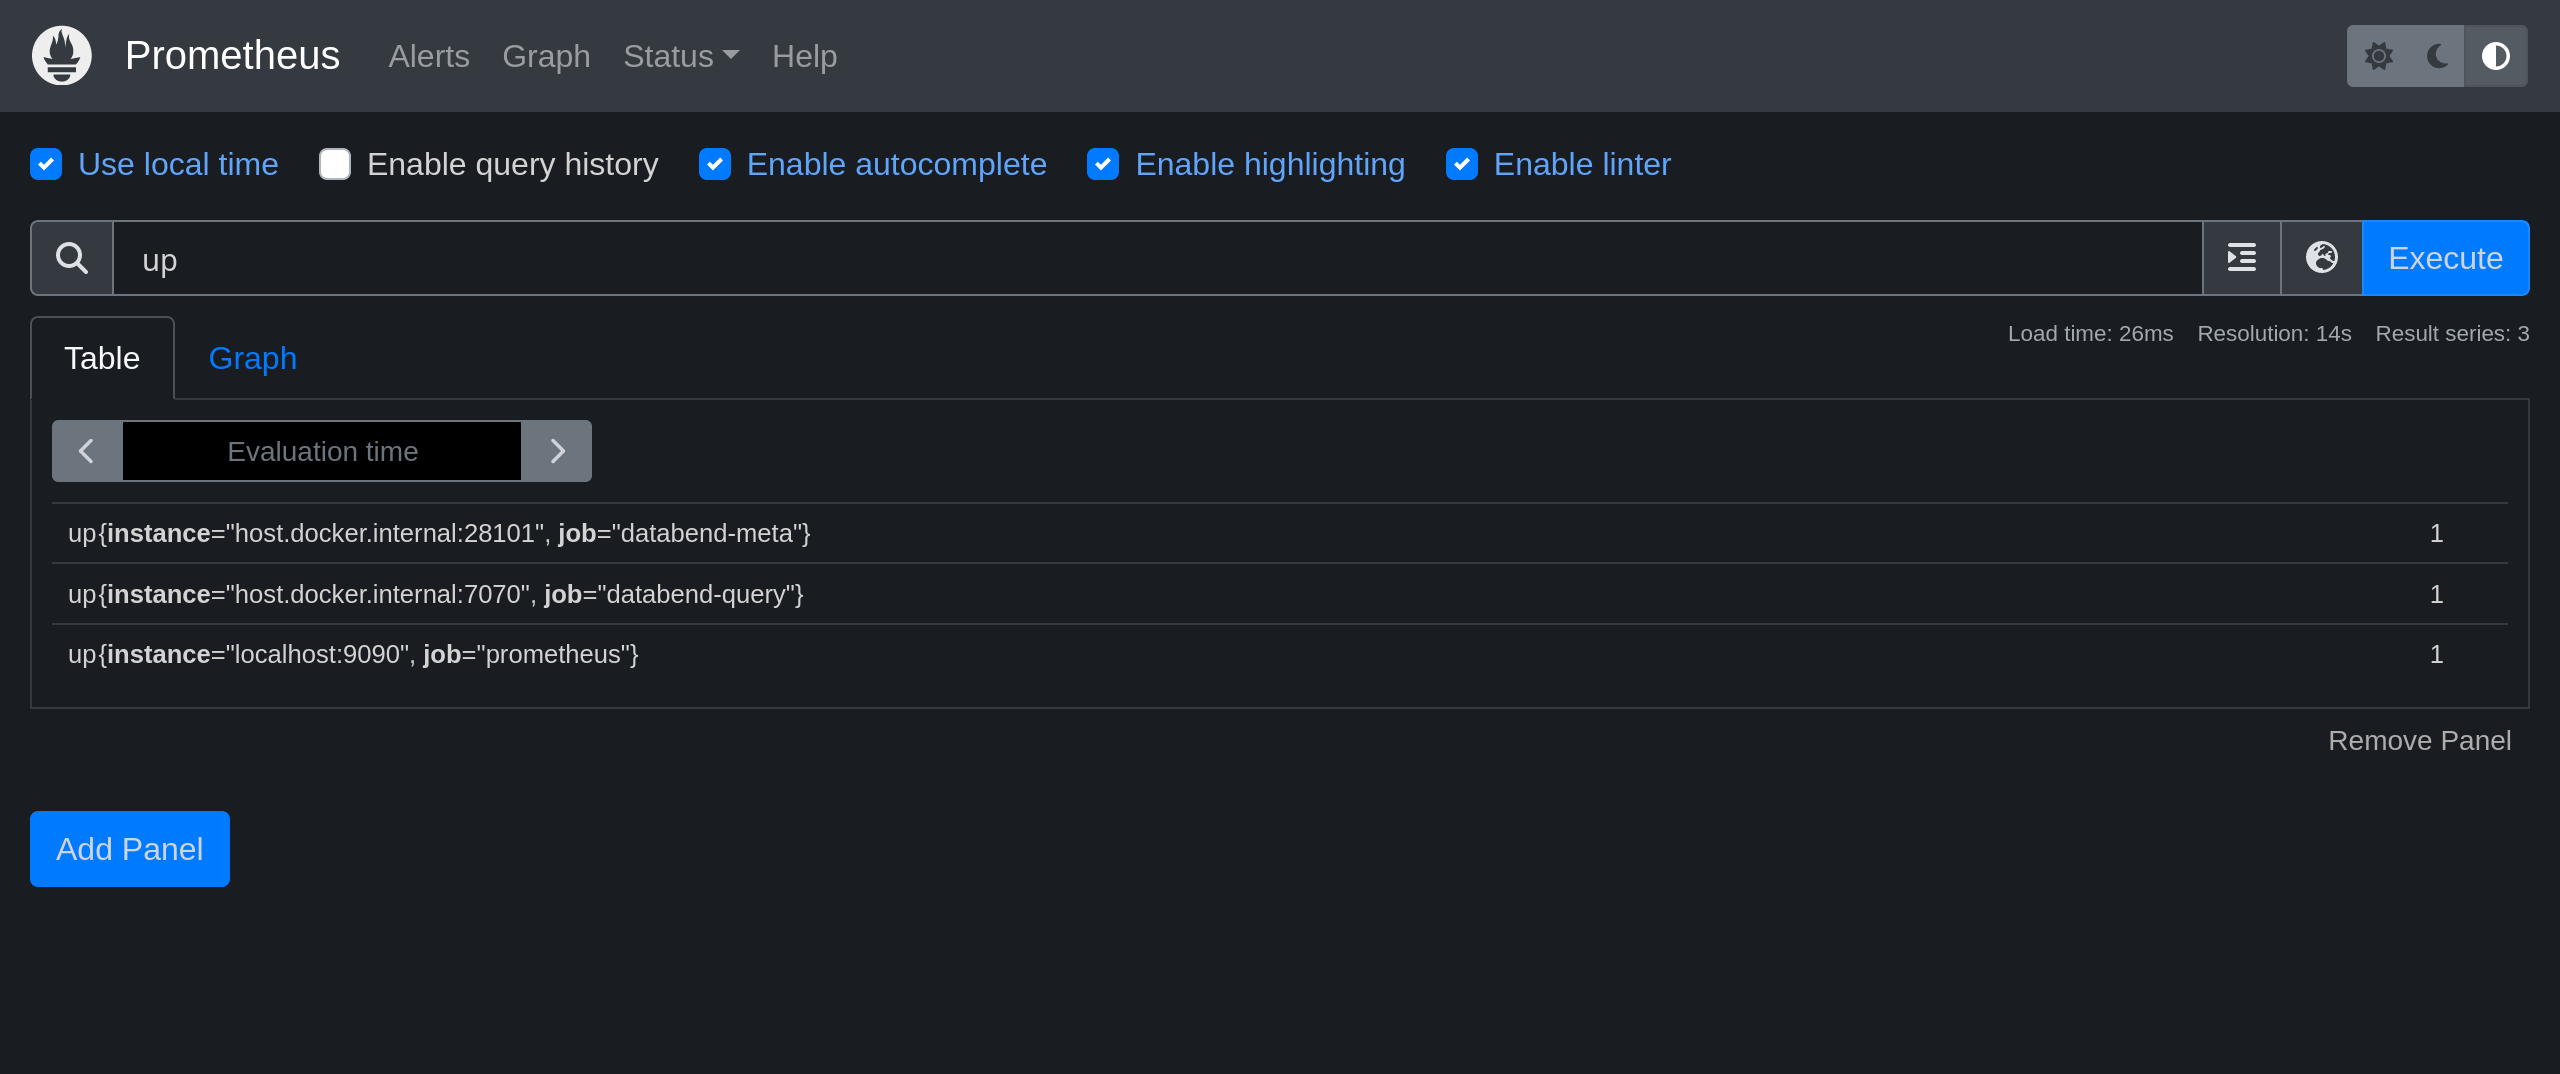
Step 3. Deploy Grafana
The steps below describe how to install and deploy Grafana using Docker.
Pull the latest Docker image of Grafana from the Docker Hub registry.
docker pull grafana/grafanaDeploy Grafana.
docker run \
-p 3000:3000 \
--add-host=host.docker.internal:host-gateway \
grafana/grafana
Add a data source of Prometheus type.
Open your web browser and go to
http://0.0.0.0:3000. Log in with the user nameadminand passwordadminfirst, and then add a data source of Prometheus type on Configuration > Data Sources > Add data source.Please note that set the URL to
http://host.docker.internal:9090for the data source.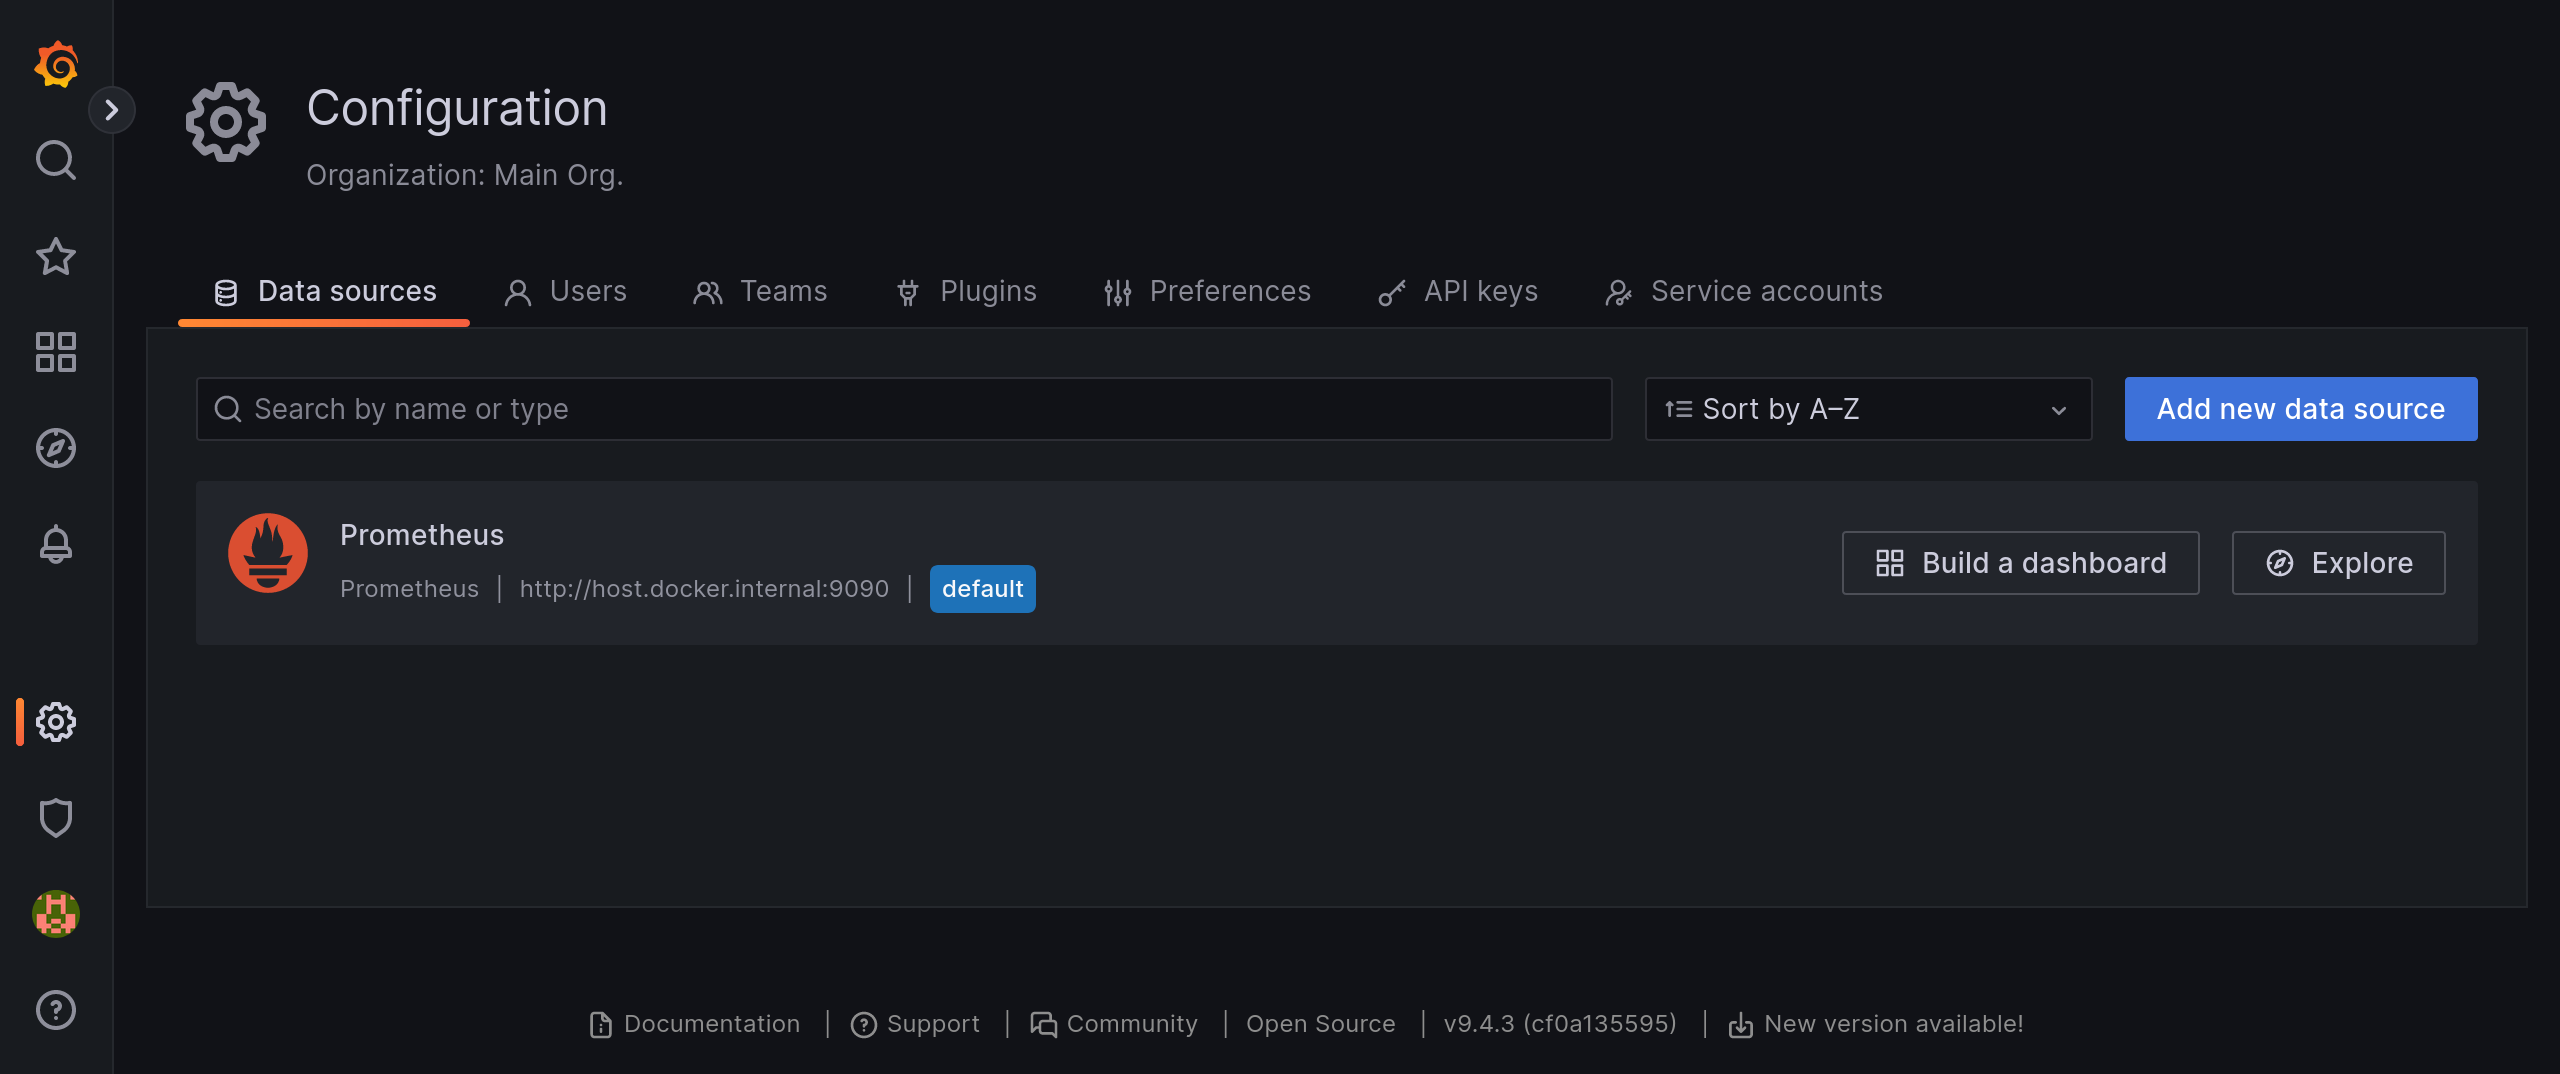
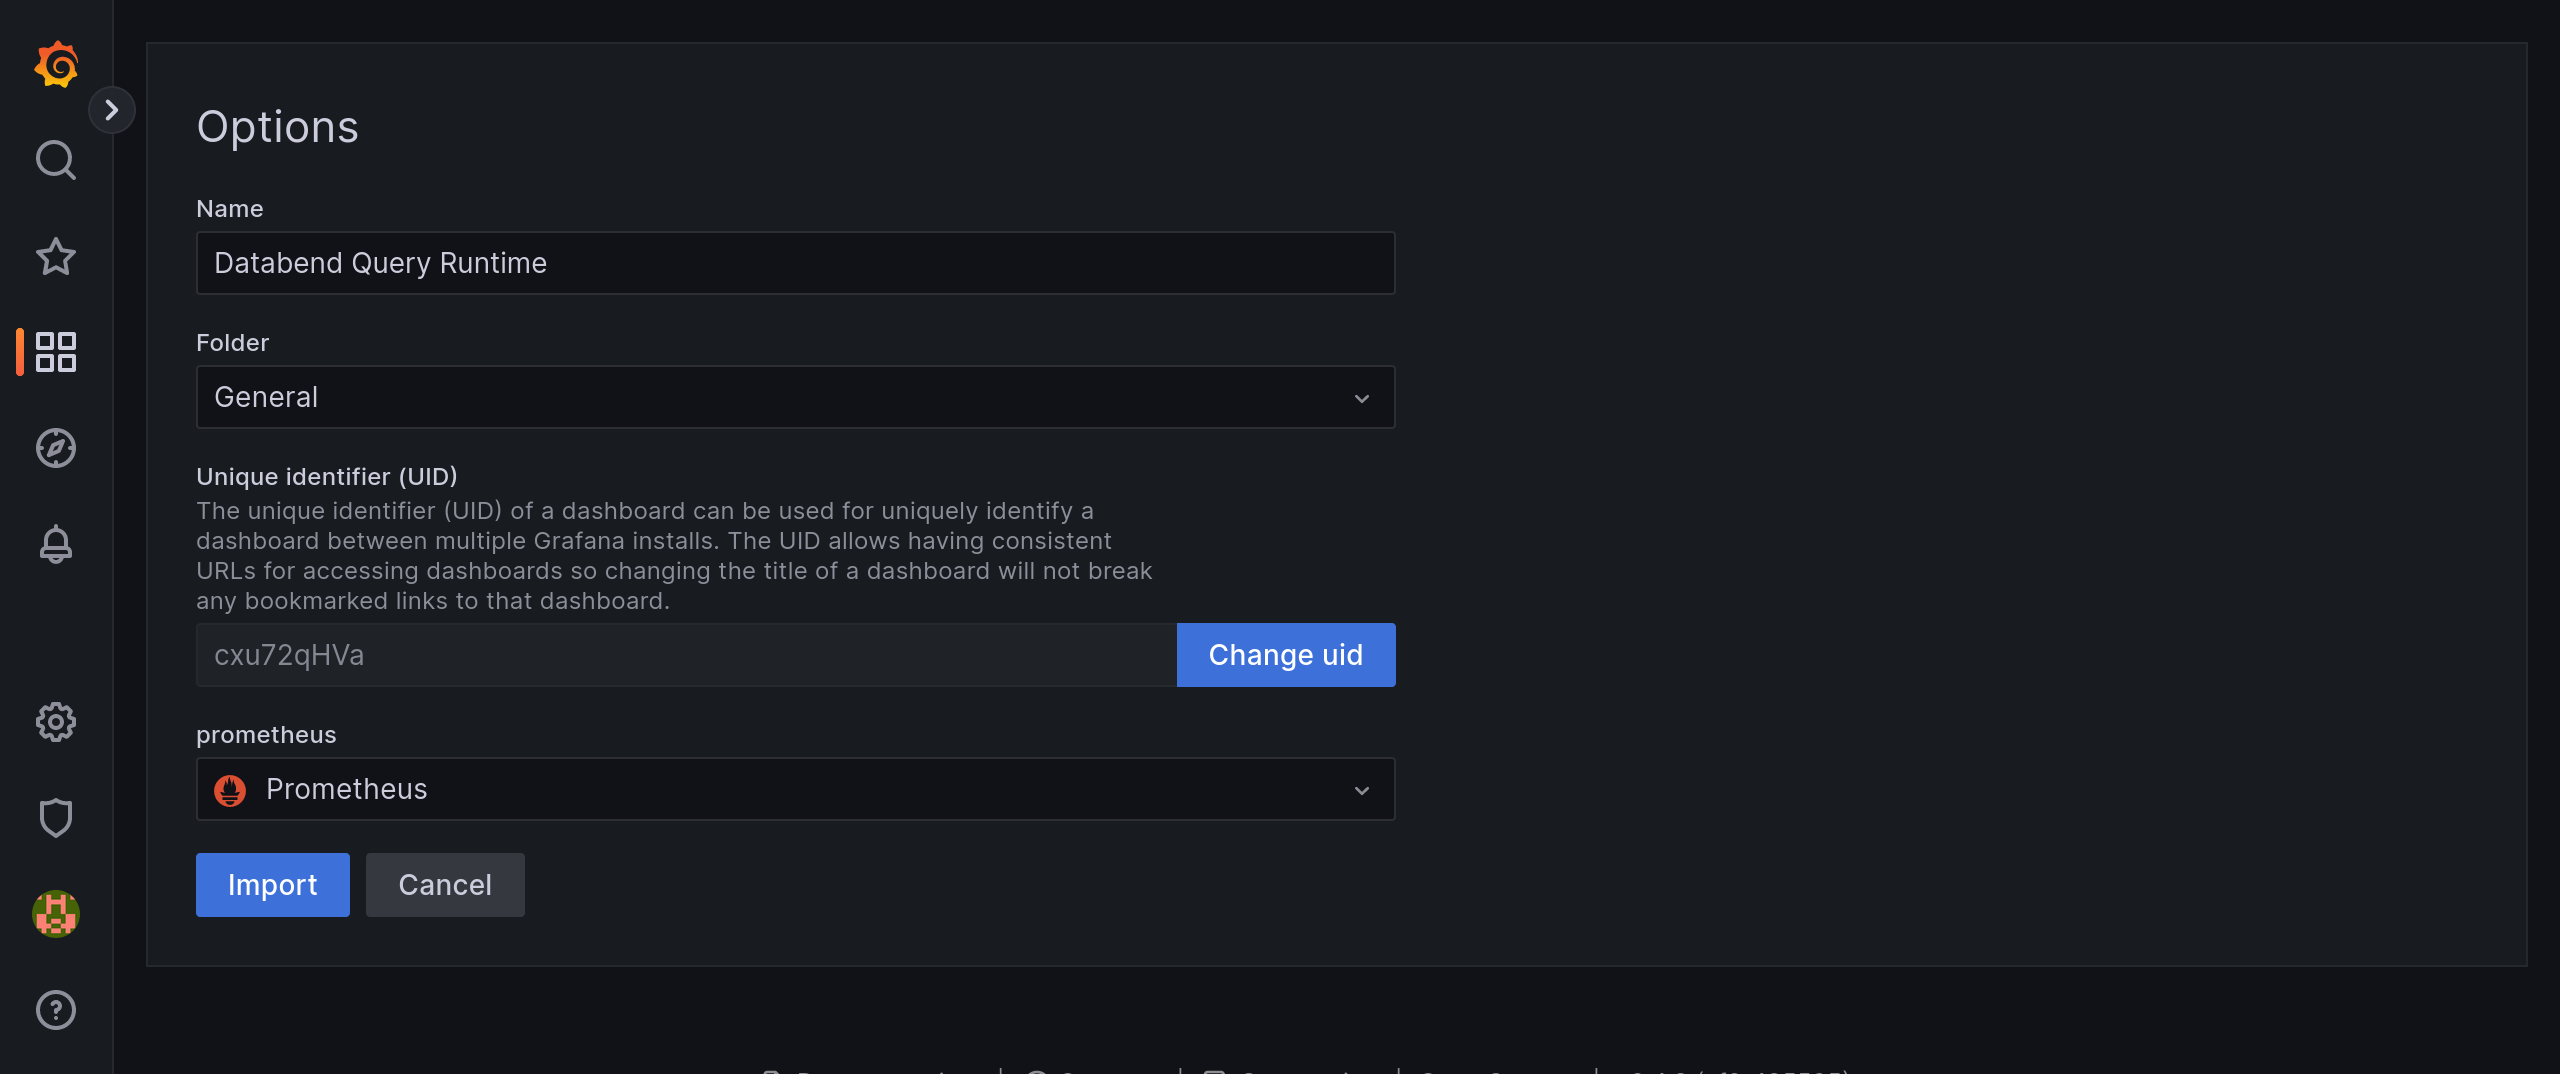
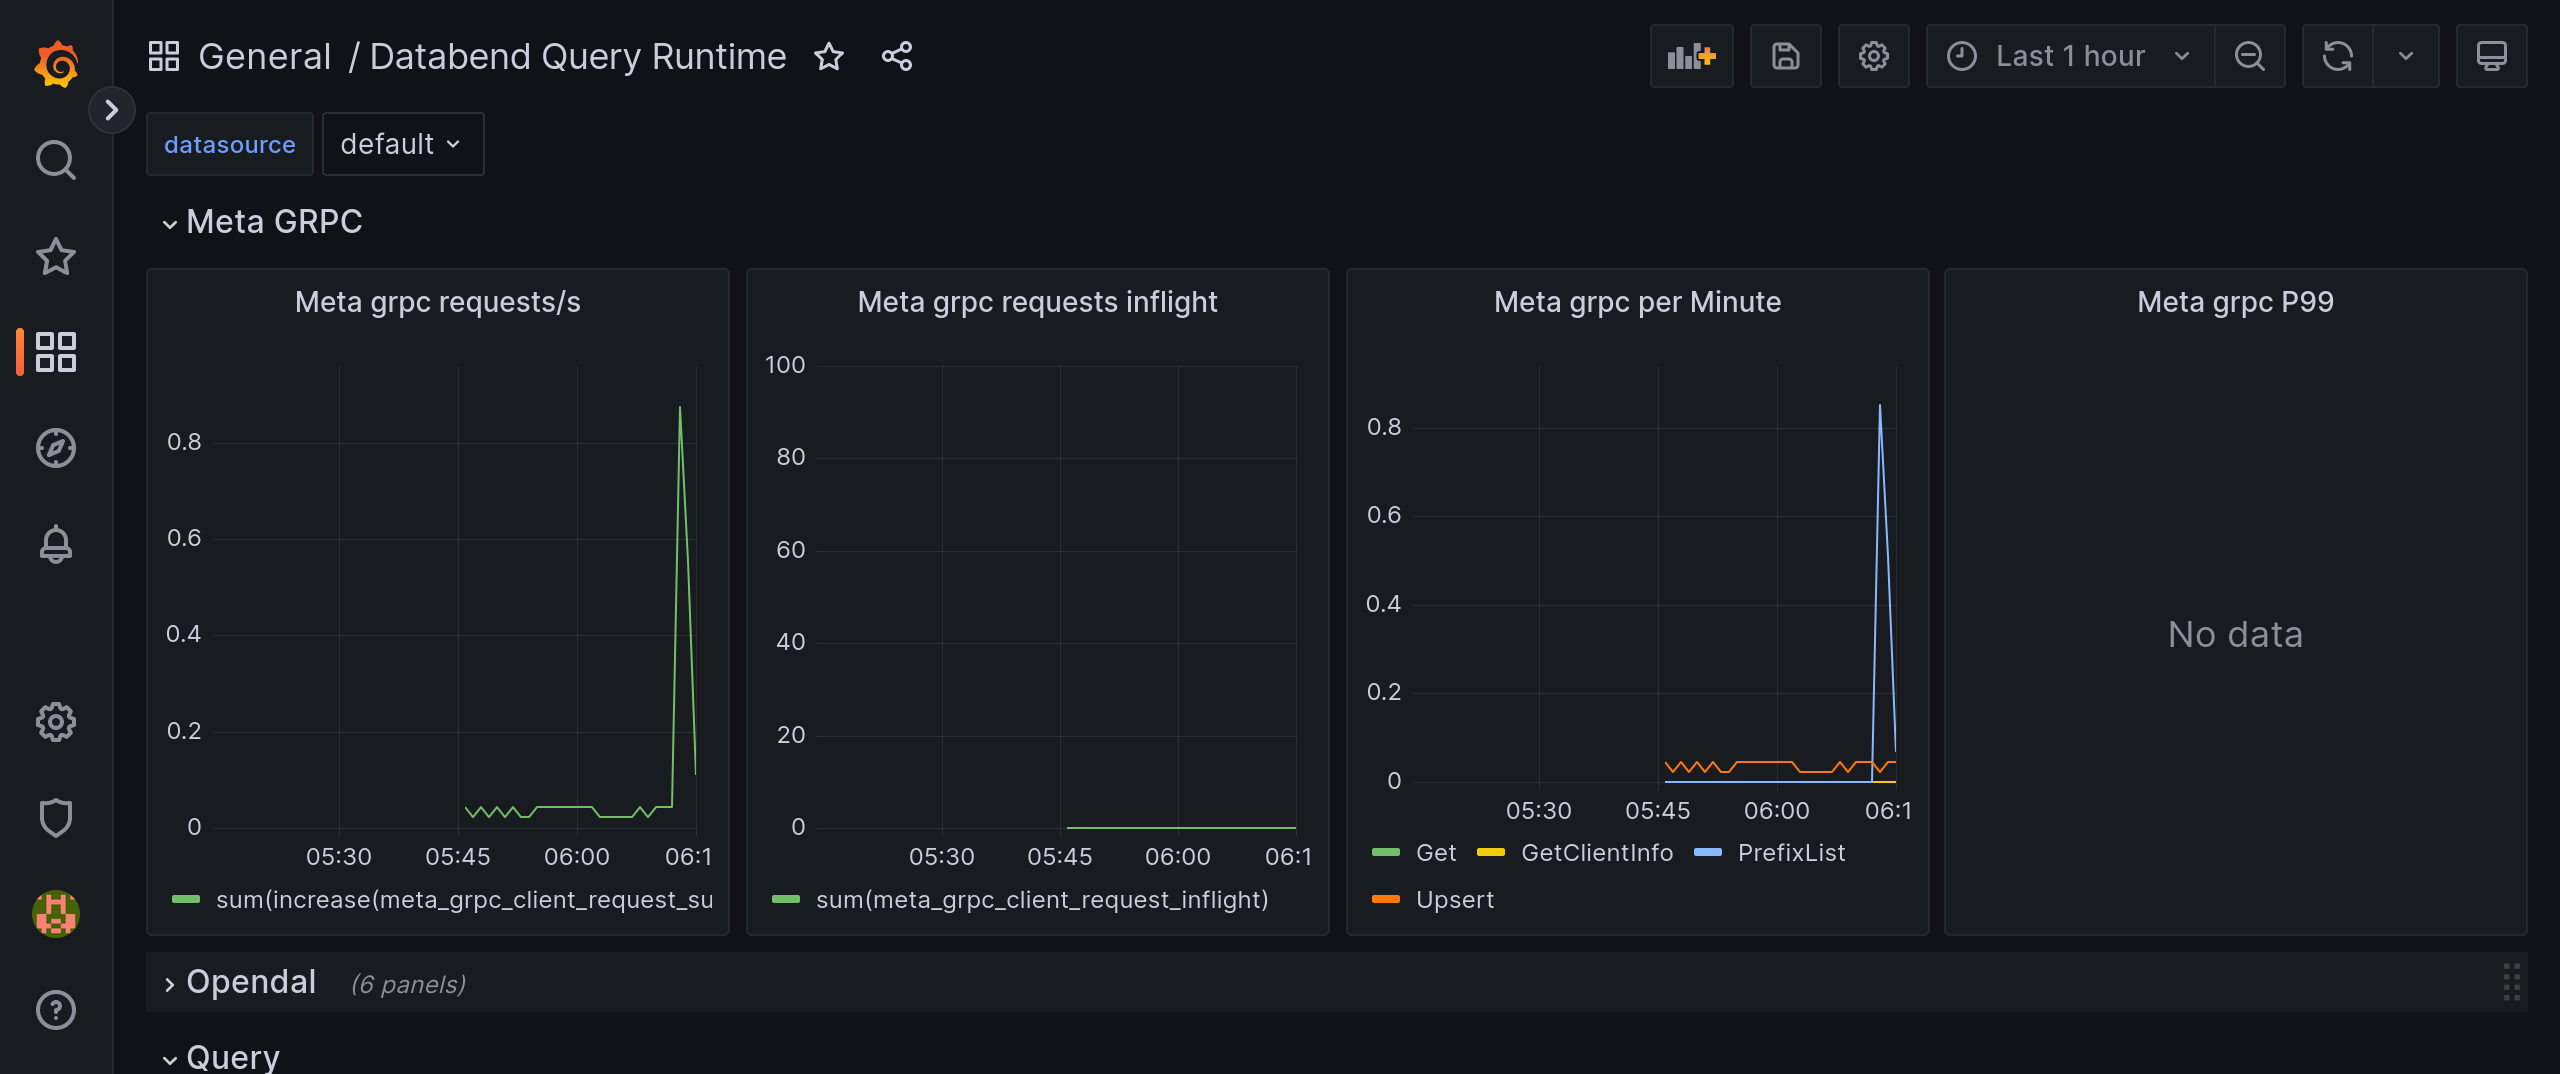
Create dashboards.
Databend recommend import the files in datafuselabs/helm-charts - dashboards to create your dashboards. To do so, download the files first, then go to
http://0.0.0.0:3000/dashboard/importto import the downloaded files one by one and select thePrometheusdata source for each dashboard.